Sky Wave, Microwave Link Communication and Satellite Communication (SATCOM)


Overview

Sky Wave, Microwave Link Communication, and Satellite Communication  (SATCOM) are the focus of this article. Sky Waves are essentially AM waves that the ionosphere reflects. For long-distance communication on Earth, we employ standard microwave link transmission. However, we all know that the earth is not flat, but rather oval in shape. As a result, the signal can only reach a few kilometers on a straight line of sight path (LOS). The signal is then reflected by the earth's surface. But we know that with that microwave link, we can communicate hundreds of kilometers distance. We'll look at how this happens in this article. Terrestrial satellite communication has now replaced microwave relay link communication.

sky wave

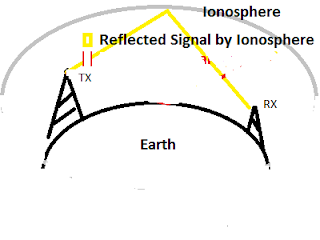
Figure: Ionosphere Reflection - suitable for AM band (Sky Wave)

1. Sky Wave

You can see how the ionosphere bounces the radio signal and enables the ground station to communicate with the transmitter hundreds of kilometers away. This method is ideal for communication at low or medium frequencies. Ionosphere reflects low (AM band) or medium (<30 MHz) range frequency.

Due to its high frequency, the microwave band cuts through the ionosphere, making it ideal for communicating with satellites. However, with the help of the ionosphere, we can efficiently receive a signal at a distance of roughly 650 kilometers from the transmitter.


1.1. Role of Ionosphere for Sky Wave

The ionosphere is one of the top levels of the earth's atmosphere, as we all know. Its altitude ranges from 30 to 600 miles above the earth's surface. We, as humans, reside in the troposphere. Atoms and molecules in the ionosphere are electrically charged. The ionosphere has the unique property of reflecting radio signals below 30 MHz. Signals with operating frequencies greater than 30 MHz penetrate the ionosphere layer. Also, do not return to Earth. In this situation, we always keep the frequency below 30 MHz. When we send a signal via a microwave link, the earth's ionosphere reflects it. In the diagram above, the transmitter emits a signal, which is then reflected by the ground and, in a similar way, by the ionosphere. According to our knowledge, a received signal reflected by the ionosphere is easier to receive by a receiver than a reflected signal by the ground.   
1.3. Frequency Range

535 to 1705 KHz


2. Microwave Link Communication

For terrestrial microwave communication, we depended largely on relay communication. For line-of-sight communication, each relay station is situated 150-200 kilometers apart. However, a key disadvantage of relay communication was that if one of the relay stations in the middle failed, the entire system would fail. As a result, we rely more on satellites. Microwave, on the other hand, is significantly more refracted by hills than low-frequency AM band. As a result, the considerable path loss is observed in the case of microwaves when employing a microwave relay link. In the case of microwave communication, the line of communication is also taken into account.  
microwave link communication


Microwave link communication is used for long-distance microwave communication. In this situation, a powerful directional microwave beam is used to go further in the earth's troposphere. 

2.1. Frequency Range:

Although microwave frequencies can range from 300 MHz to 300 GHz, we often choose sub-6 GHz frequencies or frequencies between 1 and 6 GHz for microwave link communication.

.

3. Satellite Communication

However, you should be aware that a line-of-sight connection between the transmitter and the receiver is not possible during the whole communication path. Before that signal is reflected by the ground, foliage, and other objects, it becomes scattered and weaker. On the other hand, if one intermediary relay fails, the entire communication system will stop working. As a result, we rely on the signal reflected by the satellites in this case. If there is no ionosphere or satellite, the signal can only travel 150 - 200 kilometers (approx.) as shown in the above figure. Satellite television is a real-world example of terrestrial satellite communication.

3.1. Frequency Range:

Frequencies range from 1 to 40 GHz.
satellite communication

Difference between advantages of tropospheric wave propagation and sky wave (waves reflected or refracted by ionosphere) propagation


People are good at skipping over material they already know!

View Related Topics to


Admin & Author: Salim

profile

  Website: www.salimwireless.com
  Interests: Signal Processing, Telecommunication, 5G Technology, Present & Future Wireless Technologies, Digital Signal Processing, Computer Networks, Millimeter Wave Band Channel, Web Development
  Seeking an opportunity in the Teaching or Electronics & Telecommunication domains.
  Possess M.Tech in Electronic Communication Systems.


Contact Us

Name

Email *

Message *

Popular Posts

BER vs SNR for M-ary QAM, M-ary PSK, QPSK, BPSK, ...

Modulation Constellation Diagrams BER vs. SNR BER vs SNR for M-QAM, M-PSK, QPSk, BPSK, ... What is Bit Error Rate (BER)? The abbreviation BER stands for bit error rate, which indicates how many corrupted bits are received (after the demodulation process) compared to the total number of bits sent in a communication process. It is defined as,  In mathematics, BER = (number of bits received in error / total number of transmitted bits)  On the other hand, SNR refers to the signal-to-noise power ratio. For ease of calculation, we commonly convert it to dB or decibels.   What is Signal the signal-to-noise ratio (SNR)? SNR = signal power/noise power (SNR is a ratio of signal power to noise power) SNR (in dB) = 10*log(signal power / noise power) [base 10] For instance, the SNR for a given communication system is 3dB. So, SNR (in ratio) = 10^{SNR (in dB) / 10} = 2 Therefore, in this instance, the s...

MATLAB code for BER vs SNR for M-QAM, M-PSK, QPSk, BPSK, ...

Modulation Constellation Diagrams BER vs. SNR MATLAB code for BER vs SNR for M-QAM, M-PSK, QPSk, BPSK, ...   MATLAB Script for  BER vs. SNR for M-QAM, M-PSK, QPSk, BPSK %Written by Salim Wireless %Visit www.salimwireless.com for study materials on wireless communication %or, if you want to learn how to code in MATLAB clc; clear; close all; % Parameters num_symbols = 1e5; % Number of symbols snr_db = -20:2:20; % Range of SNR values in dB % PSK and QAM orders to be tested psk_orders = [2, 4, 8, 16, 32]; qam_orders = [4, 16, 64, 256]; % Initialize BER arrays ber_psk_results = zeros(length(psk_orders), length(snr_db)); ber_qam_results = zeros(length(qam_orders), length(snr_db)); % BER calculation for each PSK order and SNR value for i = 1:length(psk_orders) psk_order = psk_orders(i); for j = 1:length(snr_db) % Generate random symbols data_symbols = randi([0, psk_order-1], 1, num_symb...

Theoretical BER vs SNR for BPSK

Let's simplify the explanation for the theoretical Bit Error Rate (BER) versus Signal-to-Noise Ratio (SNR) for Binary Phase Shift Keying (BPSK) in an Additive White Gaussian Noise (AWGN) channel.  Key Points Fig 1: Constellation Diagrams of BASK, BFSK, and BPSK [↗] BPSK Modulation: Transmits one of two signals: +√Eb ​ or -√Eb , where Eb​ is the energy per bit. These signals represent binary 0 and 1 . AWGN Channel: The channel adds Gaussian noise with zero mean and variance N0/2 (where N0 ​ is the noise power spectral density). Receiver Decision: The receiver decides if the received signal is closer to +√Eb​ (for bit 0) or -√Eb​ (for bit 1) . Bit Error Rate (BER) The probability of error (BER) for BPSK is given by a function called the Q-function. The Q-function Q(x) measures the tail probability of the normal distribution, i.e., the probability that a Gaussian random variable exceeds a certain value x.  Formula for BER: BER=Q(...

Constellation Diagrams of ASK, PSK, and FSK

Modulation ASK, FSK & PSK Constellation BASK (Binary ASK) Modulation: Transmits one of two signals: 0 or -√Eb, where Eb​ is the energy per bit. These signals represent binary 0 and 1.  BFSK (Binary FSK) Modulation: Transmits one of two signals: +√Eb​ ( On the y-axis, the phase shift of 90 degrees with respect to the x-axis, which is also termed phase offset ) or √Eb (on x-axis), where Eb​ is the energy per bit. These signals represent binary 0 and 1.  BPSK (Binary PSK) Modulation: Transmits one of two signals: +√Eb​ or -√Eb (they differ by 180 degree phase shift), where Eb​ is the energy per bit. These signals represent binary 0 and 1.  This article will primarily discuss constellation diagrams, as well as what constellation diagrams tell us and the significance of constellation diagrams. Constellation diagrams can often demonstrate how the amplitude and phase of signals or symbols differ. These two characteristics lessen the interference between t...

Theoretical and simulated BER vs. SNR for ASK, FSK, and PSK

  BER vs. SNR denotes how many bits in error are received in a communication process for a particular Signal-to-noise (SNR) ratio. In most cases, SNR is measured in decibel (dB). For a typical communication system, a signal is often affected by two types of noises 1. Additive White Gaussian Noise (AWGN) 2. Rayleigh Fading In the case of additive white Gaussian noise (AWGN), random magnitude is added to the transmitted signal. On the other hand, Rayleigh fading (due to multipath) attenuates the different frequency components of a signal differently. A good signal-to-noise ratio tries to mitigate the effect of noise.  Calculate BER for Binary ASK Modulation The theoretical BER for binary ASK (BASK) in an AWGN channel is given by: BER  = (1/2) * erfc(0.5 * sqrt(SNR_ask));   Enter SNR (dB): Calculate BER BER vs. SNR curves for ASK, FSK, and PSK Calculate BER for Binary FSK Modulation The theoretical BER for binary FSK (BFSK) in a...

OFDM in MATLAB

  MATLAB Script % The code is written by SalimWireless.Com 1. Initialization clc; clear all; close all; 2. Generate Random Bits % Generate random bits numBits = 100; bits = randi([0, 1], 1, numBits); 3. Define Parameters % Define parameters numSubcarriers = 4; % Number of subcarriers numPilotSymbols = 3; % Number of pilot symbols cpLength = ceil(numBits / 4); % Length of cyclic prefix (one-fourth of the data length) 4. Add Cyclic Prefix % Add cyclic prefix dataWithCP = [bits(end - cpLength + 1:end), bits]; 5. Insert Pilot Symbols % Insert pilot symbols pilotSymbols = ones(1, numPilotSymbols); % Example pilot symbols (could be any pattern) dataWithPilots = [pilotSymbols, dataWithCP];   6. Perform OFDM Modulation (IFFT) % Perform OFDM modulation (IFFT) dataMatrix = reshape(dataWithPilots, numSubcarriers, []); ofdmSignal = ifft(dataMatrix, numSubcarriers); ofdmSignal = reshape(ofdmSignal, 1, []); 7. Display the Generated Data % Display the generated data disp("Original Bits:"); ...

Why is Time-bandwidth Product Important?

Time-Bandwidth Product (TBP) The time-bandwidth product (TBP) is defined as: TBP = Δ f ⋅ Δ t Δf (Bandwidth) : The frequency bandwidth of the signal, representing the range of frequencies over which the signal is spread. Δt (Time duration) : The duration for which the signal is significant, i.e., the time interval during which the signal is non-zero. The TBP is a measure of the "spread" of the signal in both time and frequency domains. A higher TBP means the signal is both spread over a larger time period and occupies a wider frequency range.     To calculate the period of a signal with finite bandwidth, Heisenberg’s uncertainty principle plays a vital role where the time-bandwidth product indicates the processing gain of the signal. We apply spread spectrum techniques in wireless communication for various reasons, such as interference resili...