
Gauss-Seidel Method


Gauss-Seidel Method

In numerical linear algebra, the Gauss–Seidel method, also known as the Liebmann method or the method of successive displacement, is an iterative method used to solve a system of a strictly diagonally dominant system of linear equations.

Procedure

  1. Choose an n X n matrix

Otherwise- Show Pop up – please select the number of rows equal to the number of Columns

  1. Verify that the magnitude of the diagonal item in each row of the matrix is greater than or equal to the sum of the magnitudes of all other (non-diagonal) values in that row so that
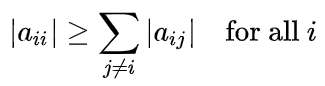
Otherwise- Show Pop up – entered matrix is not diagonally dominant

Ensure that all of the diagonal elements are non-zero as well.

aii ≠ 0

Otherwise- Show Pop up – all of the diagonal elements must be non-zero

  1. Decompose the given matrix A into a lower triangular matrix L*, and a strictly upper triangular matrix U:

Let’s assume, A linear system of the form ��=�Ax = b

L* = $\begin{bmatrix} a11 & 0 & \cdots & 0 \\ a21 & a22 & 0 & 0 \\ \vdots & \vdots & \ddots & \vdots \\ an1 & an2 & \cdots & ann \end{bmatrix}$;

U = $\begin{bmatrix} 0 & a12 & \cdots & a1n \\ 0 & 0 & .\ .\ . & a2n \\ \vdots & \vdots & \ddots & \vdots \\ 0 & 0 & \cdots & 0 \end{bmatrix}$;

An upper triangular matrix differs significantly from a strictly upper triangular matrix in that an upper triangular matrix contains all zero elements below the diagonal while a strictly upper triangular matrix contains all zeroes on the diagonal also.

  1. Now we’ve to choose a column matrix x(0) of size n X 1 containing only 1s

x(0) = $\begin{bmatrix} x1 \\ x2 \\ \vdots \\ xn \end{bmatrix}$, where, x1 = x2 = x3 = . . . = xn = 1

  1. The system of linear equations can be rewritten as

Ax = b

Or, (L* + U)x = b

Or, L*x + Ux = b

Or, L*x = b – Ux

Firstly, we can only guess starting points of x, then go to the next iteration and put the updated value of x as shown in the example below

Or, x(k+1) = L*-1(b – Ux(k))

Repeat the iteration process until either the value of x(k) converges or the error, (Ax – b) becomes very tiny. For greater precision, you can choose a threshold value of 1e-8 or 1e-10. Stop the iteration procedure if the value of the error, (Ax - b), is less than 1e-8 or 1e-10. Additionally, you can initially set the program's total iterations to 1000 at the beginning.

Example

Use the iterative Gauss-Seidel method to solve the problem. There are equations

16x + 3y = 11

7x - 11y = 13

Taking values from the aforementioned equations, we obtain,

A = $\begin{bmatrix} 16 & 3 \\ 7 & - 11 \end{bmatrix}$; b = $\begin{bmatrix} 11 \\ 13 \end{bmatrix}$;

Let’s initialize, x(0) =$\begin{bmatrix} 1 \\ 1 \end{bmatrix}$;

Then calculate,

1st iteration

x(1) = L*-1(b – Ux(0)))

= L*-1b - L*-1Ux(0)

= $\begin{bmatrix} 16 & 0 \\ 7 & - 11 \end{bmatrix}$-1 * $\begin{bmatrix} 11 \\ 13 \end{bmatrix}$ - $\begin{bmatrix} 16 & 0 \\ 7 & - 11 \end{bmatrix}$-1 * $\begin{bmatrix} 0 & 3 \\ 0 & 0 \end{bmatrix}$ * $\begin{bmatrix} 1 \\ 1 \end{bmatrix}$

= $\begin{bmatrix} 0.0625 & 0 \\ 0.0398 & - 0.0909 \end{bmatrix}$ * $\begin{bmatrix} 11 \\ 13 \end{bmatrix}\ $- $\begin{bmatrix} 0.0625 & 0 \\ 0.0398 & - 0.0909 \end{bmatrix}$ * $\begin{bmatrix} 0 & 3 \\ 0 & 0 \end{bmatrix}$ * $\begin{bmatrix} 1 \\ 1 \end{bmatrix}$

= $\begin{bmatrix} 0.6875 \\ - 0.7439 \end{bmatrix}$ - $\begin{bmatrix} 0 & - 0.1875 \\ 0 & - 0.1194 \end{bmatrix}$* $\begin{bmatrix} 1 \\ 1 \end{bmatrix}$

= $\begin{bmatrix} 0.5000 \\ - 0.8636 \end{bmatrix}$

2nd Iteration

x(2) = L*-1(b – Ux(1)))

= L*-1b - L*-1Ux(1)

= $\begin{bmatrix} 16 & 0 \\ 7 & - 11 \end{bmatrix}$-1 * $\begin{bmatrix} 11 \\ 13 \end{bmatrix}$ - $\begin{bmatrix} 16 & 0 \\ 7 & - 11 \end{bmatrix}$-1 * $\begin{bmatrix} 0 & 3 \\ 0 & 0 \end{bmatrix}$ * $\begin{bmatrix} 0.5000 \\ - 0.8636 \end{bmatrix}$

= $\begin{bmatrix} 0.8494 \\ - 0.6413 \end{bmatrix}$

3rd Iteration

x(3) = L*-1(b – Ux(2)))

= L*-1b - L*-1Ux(2)

= $\begin{bmatrix} 0.8077 \\ - 0.6678 \end{bmatrix}$

4th Iteration

x(4) = L*-1(b – Ux(3)))

= L*-1b - L*-1Ux(3)

= $\begin{bmatrix} 0.8127 \\ - 0.6646 \end{bmatrix}$

5th Iteration

x(5) = L*-1(b – Ux(4)))

= L*-1b - L*-1Ux(4)

= $\begin{bmatrix} 0.8121 \\ - 0.6650 \end{bmatrix}$

6th Iteration

x(6) = L*-1(b – Ux(5)))

= L*-1b - L*-1Ux(5)

= $\begin{bmatrix} 0.8122 \\ - 0.6650 \end{bmatrix}$

7th Iteration

x(7) = L*-1(b – Ux(6)))

= L*-1b - L*-1Ux(6)

= $\begin{bmatrix} 0.8122 \\ - 0.6650 \end{bmatrix}$

As expected, the algorithm converges to the exact solution

Now the approximate value of x and y are 0.8122 and -0.6650, respectively.

(for the programming perspective)

Repeat the iteration process until either the value of x(k) converges or the error, (Ax – b) becomes very tiny. For greater precision, you can choose a threshold value of 1e-8 or 1e-10. Stop the iteration procedure if the value of the error, (Ax - b), is less than 1e-8 or 1e-10. Additionally, you can initially set the program's total iterations to 1000 at the beginning.

Contact Us

Name

Email *

Message *

Popular Posts

Q-function in BER vs SNR Calculation (with Simulation)

Q-function in BER vs. SNR Calculation In digital communications and signal processing, the Q-function plays a significant role in predicting system reliability. It allows engineers to quantify the probability that Gaussian noise will exceed a specific threshold, causing a bit error. What is the Q-function? The Q-function is a mathematical function representing the tail probability of the standard normal (Gaussian) distribution. It is the complementary cumulative distribution function (CCDF) of a standard Gaussian distribution. Q(x) = (1 / √(2Ï€)) ∫â‚“∞ e^(-t² / 2) dt Q-Function Interactive Simulator Move the slider to see how the "Tail Probability" (the area in red) changes. This area represents the Probability of Error (BER) . Threshold Distance ( x ) — (Simulates Increasing SNR) x = 1.0 Q(x) = 0.1587 ...

BER vs SNR for M-ary QAM, M-ary PSK, QPSK, BPSK, ...(MATLAB Code + Simulator)

Bit Error Rate (BER) & SNR Guide Analyze communication system performance with our interactive simulators and MATLAB tools. 📘 Theory 🧮 Simulators 💻 MATLAB Code 📚 Resources BER Definition SNR Formula BER Calculator MATLAB Comparison 📂 Explore M-ary QAM, PSK, and QPSK Topics ▼ 🧮 Constellation Simulator: M-ary QAM 🧮 Constellation Simulator: M-ary PSK 🧮 BER calculation for ASK, FSK, and PSK 🧮 Approaches to BER vs SNR What is Bit Error Rate (BER)? The BER indicates how many corrupted bits are received compared to the total number of bits sent. It is the primary figure of merit f...

Frequency Shift Keying (FSK) Modulation & Demodulation (with Simulation)

Frequency Shift Keying (FSK) Theoretical Foundations: Frequency Shift Keying (FSK) is a discrete frequency modulation scheme wherein the digital information is encoded via instantaneous shifts in the carrier signal's frequency. The fundamental implementation is Binary FSK (BFSK), which maps binary data onto two distinct, discrete spectral states. A binary '1' (the "mark" state) is represented by a carrier frequency \( f_1 \), while a binary '0' (the "space" state) corresponds to frequency \( f_2 \). Each symbol is sustained for a bit interval denoted by \( T_b \). FSK Transmitter Characterization: The mathematical model for the modulated BFSK output \( s(t) \) is defined as: \[ s(t) = \begin{cases} A_c \cos(2\pi f_1 t), & \text{for } m = 1 \\ A_c \cos(2\pi f_2 t), & \text{for } m = 0 \end{cases} \] ...

RMS Delay Spread, Excess Delay Spread and Multi-path ...(with MATLAB + Simulator)

📘 Overview of Delay Spread and Multi-path 🧮 Excess Delay spread 🧮 Power delay Profile 🧮 RMS Delay Spread 📚 Further Reading 📂 Other Topics on RMS Delay Spread, Excess Delay ... 🧮 Multipath Components or MPCs 🧮 Online Simulator for Calculating RMS Delay Spread 🧮 Why is there significant multipath in the case of very high frequencies? 🧮 Why RMS Delay Spread is essential for wireless communication? 🧮 Why the Power Delay Profile is essential? 🧮 MATLAB Codes for Calculating Different Types of delay Spreads Delay Spread, Excess Delay Spread, and Multipath (MPCs) The fundamental distinction between wireless and wired connections is that in wireless connections signal reaches at receiver thru multipath signal propagation rather than directed transmission like co-axial cable. Wireless Communication has no set communication path between the transmitter and the receiver. The line...

OFDM Symbols and Subcarriers Explained

This article explains how OFDM (Orthogonal Frequency Division Multiplexing) symbols and subcarriers work. It covers modulation, mapping symbols to subcarriers, subcarrier frequency spacing, IFFT synthesis, cyclic prefix, and transmission. Step 1: Modulation First, modulate the input bitstream. For example, with 16-QAM , each group of 4 bits maps to one QAM symbol. Suppose we generate a sequence of QAM symbols: s0, s1, s2, s3, s4, s5, …, s63 Step 2: Mapping Symbols to Subcarriers Assume N sub = 8 subcarriers. Each OFDM symbol in the frequency domain contains 8 QAM symbols (one per subcarrier): Mapping (example) OFDM symbol 1 → s0, s1, s2, s3, s4, s5, s6, s7 OFDM symbol 2 → s8, s9, s10, s11, s12, s13, s14, s15 … OFDM sym...

Orthogonal Time Frequency Space (OTFS) (with MATLAB)

In OTFS (Orthogonal Time Frequency Space) modulation — a scheme designed for high-Doppler and time-varying wireless channels — the terms ISFFT and SFFT are key mathematical transformations used to move between different representation domains. Figure: OTFS block diagram 1. ISFFT — Inverse Symplectic Finite Fourier Transform Purpose: Transforms data symbols from the delay-Doppler domain to the time-frequency domain . \[ X[n, m] = \frac{1}{\sqrt{NM}} \sum_{k=0}^{N-1} \sum_{l=0}^{M-1} x[k, l] \, e^{j2\pi \left( \frac{nk}{N} - \frac{ml}{M} \right)} \] Here, \( N \) is the number of Doppler bins (time slots), and \( M \) is the number of delay bins (subcarriers). The ISFFT maps each data symbol from the delay-Doppler grid (where the channel is sparse and easier to equalize) to the time-frequency grid (where standard multicarrier modulation like OFDM can be applied). 2. SFFT — Symplectic Finite Fourier Transform Purpose: Performs the reverse operation ...

Choke Input Filter Explained

  Choke Input Filter Choke Input Filter A well-designed choke input filter is a type of power supply filter used to smooth the output of a rectifier (like in DC power supplies). It uses an inductor (choke) as the first component right after the rectifier, followed by a capacitor. Basic Structure Rectifier → Choke (L) → Capacitor (C) → Load What Makes It Well-Designed? Critical Inductance is satisfied: The choke must have enough inductance to keep current flowing continuously. This minimum value is called critical inductance. Low ripple output: A good design significantly reduces AC ripple in the DC output. The choke resists sudden changes in current. Proper load current: Works best when the load current is above a certain minimum level. Too light a load results in poor filter...