
Analog Beamforming vs Digital beamforming


1. Analog Beamforming:

Beamforming is a method of focusing a signal in a certain direction to provide sufficient signal strength at the receiver end of the communication process. We normally require more than one closely located antenna to form a beam in a specific direction and focus the resultant signal from antennas to use beam forming. We can also use phase shifters (PSs) to control the phases of a signal. We employ MIMO (multiple input multiple output antenna) [↗] to provide beam forming. In a MIMO system, antennas are normally positioned in a half-wavelength interval of the operating frequency.


We commonly employ beam forming when we need to send a signal over a great distance (e.g., for radar communication) and omnidirectional transmission isn't feasible. On the other hand, we can use beam forming to extend the range of our signal without boosting TX power.


Similarly, 5G communication [Read More] makes advantage of an incredibly high frequency [↗]. As a result, it suffers from severe path loss [↗], and its short wavelength is easily absorbed by air gases, vapor, and other particles. With sufficient power, such an extremely high-frequency band can only go a short distance. As a result, we use beam forming to cover greater distances. We get a stronger and narrower beam by increasing the number of antennas without raising the TX power. It is an important advantage of beamforming.

There are several methods of beam formation, but they are usually divided into three categories: 1. Analog beam forming 2. Digital Beamforming 3. Hybrid Beamforming. In analog beam formation, the beam is steered at both the transmitter and receiver end, and the best beam pairs are selected for communication. More simply, we aim to send signals at varying angles of departure, or AOD, from the transmitter side. We do the same thing using angles of arrival (AOA) on the receiver side, then only connect the best beams from both the transmitter and receiver sides. We can only change the phases (or, the direction of signal transmission) of a signal in analog beam forming, and there is only one data stream between the transmitter and receiver.
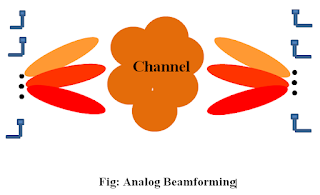
 
analog beamforming
Get MATLAB Code for Analog and Digital Beamforming


The number of antennas on both the transmitter and receiving sides may be seen in the diagram above. To form a beam, more than one neighboring antenna is required. The fact that there is just one RF Chain on both the transmitter and receiver sides is a crucial aspect of analog beam formation. The number of RF chains determines the number of simultaneous data streams accessible between the transmitter and receiver. In the diagram above, we steer the beam at the transmitter to find the optimal beam, while the receiver listens in an omnidirectional manner. The same thing happens at the receiver's end, where the receiver tries directional beams while the transmitter radiates in an omnidirectional manner. Then, using adequate feedback, the best beam pairs from both sides are connected. RF chains contain mixers, power amplifiers, etc.

In the following chapters, we'll look into digital beam forming, which allows multiple data streams to be sent and received simultaneously. We'll also talk about canceling interference between many devices and canceling interference between simultaneous data streams.


2. Digital Beamforming:

Unlike analog pre-coding, we can send signals with a variety of phases and amplitudes. Different phases signify different things, such as the ability to steer the beam in different directions. On the other hand, we can also regulate the transmitted signal's amplitude. If we need to reduce the signal's amplitude in a specific antenna element, we can easily do it.

The signal that was received is denoted by

y=√pHDs + n
where, p=average received power
H=channel matrix
D= digital or baseband pre-coder
s= symbol vector
n = additive white Gaussian noise

Each antenna is connected to a distinct transmit and receive (TR) module or RF chain in the system diagram below.
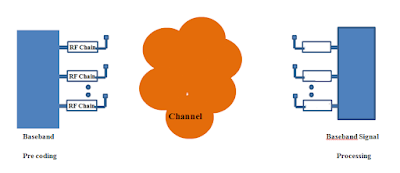

analog beamforming

Fig: Digital Beamforming


We know that point-to-point communication between MIMO is conceivable, such as h11, h12, h22, and so on. For example, 'h22' denotes channel gain or the link between the second antenna on the transmitter and the second antenna on the receiver. 


Also Read about:

more ...


Contact Us

Name

Email *

Message *

Popular Posts

MATLAB Code for MUSIC

  MATLAB Code clc; clear; close all ; %% Step 1: Define Parameters M = 8; % Number of array sensors d = 0.5; % Sensor spacing (lambda/2) K = 2; % Number of signals N = 200; % Number of snapshots theta = [-20 30]; % True signal angles (degrees) SNR = 10; % Signal-to-noise ratio (dB) fprintf( 'Step 1: Parameters Initialized\n' ); %% Step 2: Generate Signal Sources t = 1:N; s1 = exp(1j*2*pi*0.05*t); s2 = exp(1j*2*pi*0.1*t); S = [s1; s2]; figure; plot(real(S(1,:))) title( 'Signal 1 (Real Part)' ) xlabel( 'Samples' ) ylabel( 'Amplitude' ) figure; plot(real(S(2,:))) title( 'Signal 2 (Real Part)' ) xlabel( 'Samples' ) ylabel( 'Amplitude' ) fprintf( 'Step 2: Source Signals Generated\n' ); %% Step 3: Construct Steering Matrix A = zeros(M,K); for k = 1:K A(:,k) = exp(-1j*2*pi*d*(0:M-1)'*sin(theta(k)*pi/180)); end fprintf( 'Step 3: Steering Matr...

MATLAB code for BER vs SNR for M-QAM, M-PSK, QPSK, BPSK (with Simulation)

🧮 MATLAB Code for BPSK, M-ary PSK, and M-ary QAM Together 🧮 MATLAB Code for M-ary QAM 🧮 MATLAB Code for M-ary PSK 📚 Further Reading MATLAB Script for BER vs. SNR for M-QAM, M-PSK, QPSK, BPSK % Written by Salim Wireless clc; clear; close all; snr_db = -5:2:25; psk_orders = [2, 4, 8, 16, 32]; qam_orders = [4, 16, 64, 256]; ber_psk_results = zeros(length(psk_orders), length(snr_db)); ber_qam_results = zeros(length(qam_orders), length(snr_db)); for i = 1:length(psk_orders) ber_psk_results(i, :) = berawgn(snr_db, 'psk', psk_orders(i), 'nondiff'); end for i = 1:length(qam_orders) ber_qam_results(i, :) = berawgn(snr_db, 'qam', qam_orders(i)); end figure; semilogy(snr_db, ber_psk_results(1, :), 'o-', 'LineWidth', 1.5, 'DisplayName', 'BPSK'); hold on; for i = 2:length(psk_orders) semilogy(snr_db, ber_psk_results(i, :), 'o-', 'DisplayName', sprintf('%d-PSK', psk_or...

Theoretical BER vs SNR for BPSK

Theoretical Bit Error Rate (BER) vs Signal-to-Noise Ratio (SNR) for BPSK in AWGN Channel Let’s simplify the explanation for the theoretical Bit Error Rate (BER) versus Signal-to-Noise Ratio (SNR) for Binary Phase Shift Keying (BPSK) in an Additive White Gaussian Noise (AWGN) channel. Key Points Fig. 1: Constellation Diagrams of BASK, BFSK, and BPSK [↗] BPSK Modulation Transmits one of two signals: +√Eb or −√Eb , where Eb is the energy per bit. These signals represent binary 0 and 1 . AWGN Channel The channel adds Gaussian noise with zero mean and variance N₀/2 (where N₀ is the noise power spectral density). Receiver Decision The receiver decides if the received signal is closer to +√Eb (for bit 0) or −√Eb (for bit 1) . Bit Error Rat...

PSD Calculation with FFT: MATLAB Tutorial for Signal Analysis

  Implementation Steps 1. FFT Computes the Frequency Content of a Signal FFT converts a time-domain signal to the frequency domain. If: The signal is sampled at rate $f_s$ You compute an $N_{\text{FFT}}$-point FFT Then each FFT bin corresponds to a frequency resolution of: $$\Delta f = \frac{f_s}{N_{\text{FFT}}}$$ So the FFT gives you accurate frequency content, assuming the signal is stationary and adequately sampled (Nyquist criterion met).  2. Magnitude Squared Gives Power (Not Amplitude) $$P[k] = |X[k]|^2$$ This gives power at each frequency bin, not just amplitude. It represents how much energy is present at each frequency. It's a key step for PSD.  3. Normalization Makes the PSD Physically Meaningful The equation: $$\text{PSD}[k] = \frac{|X[k]|^2}{N_{\text{FFT}} \cdot f_s \cdot U}$$ is derived from first principles and ensures that the u...

Direction of Arrival (DoA) Online Simulator (using MUSIC)

Interactive DOA Simulator X-axis XY angle (deg): 45 XZ angle (deg): 30 Noise: 0.05 Y-axis XY angle (deg): 60 YZ angle (deg): 45 Noise: 0.05 Z-axis XZ angle (deg): 60 YZ angle (deg): 30 Noise: 0.05 Estimated DOA (deg): 0 Simulation Workflow and Mathematical Background This simulator demonstrates Direction of Arrival (DOA) estimation using three-axis sensor signals (X, Y, Z), Maximal Ratio Combining (MRC) , and the MUSIC algorithm . It allows interactive control of signal angles and noise for teaching purposes. 1. Signal Generation A pure sinewave signal of frequency f is projected onto three axes using user-defined angles in different planes: X-axis: θ XY , θ XZ Y-axis: θ XY , θ YZ Z-axis: θ XZ , θ YZ Mathematically, for each time sample t : x(t) = s(t) * cos(θ_xy_x) * cos(θ_xz_x) + n_x(t) y(t) = s(t) * sin(θ_xy_y) * cos(θ_yz_y) + n_y(t) z(t) = s(t) * sin(θ_xz_z) * sin(θ_yz_z) + n_z(t) wh...

Power Spectral Density Calculation Using FFT in MATLAB

📘 📘 Overview 🧮 🧮 Steps to calculate 💻 🧮 MATLAB Codes 📚 📚 Further Reading Power spectral density (PSD) tells us how the power of a signal is distributed across different frequency components, whereas Fourier Magnitude gives you the amplitude (or strength) of each frequency component in the signal. Steps to calculate the PSD of a signal Firstly, calculate the fast Fourier transform (FFT) of a signal. Then, calculate the Fourier magnitude (absolute value) of the signal. Square the Fourier magnitude to get the power spectrum. To calculate the Power Spectral Density (PSD), divide the squared magnitude by the product of the sampling frequency (fs) and the total number of samples (N). Formula: PSD = |FFT|^2 / (fs * N) Sampling frequency (fs): The rate at which the continuous-time signal is sampled (in Hz). ...

OFDM Symbols and Subcarriers Explained

This article explains how OFDM (Orthogonal Frequency Division Multiplexing) symbols and subcarriers work. It covers modulation, mapping symbols to subcarriers, subcarrier frequency spacing, IFFT synthesis, cyclic prefix, and transmission. Step 1: Modulation First, modulate the input bitstream. For example, with 16-QAM , each group of 4 bits maps to one QAM symbol. Suppose we generate a sequence of QAM symbols: s0, s1, s2, s3, s4, s5, …, s63 Step 2: Mapping Symbols to Subcarriers Assume N sub = 8 subcarriers. Each OFDM symbol in the frequency domain contains 8 QAM symbols (one per subcarrier): Mapping (example) OFDM symbol 1 → s0, s1, s2, s3, s4, s5, s6, s7 OFDM symbol 2 → s8, s9, s10, s11, s12, s13, s14, s15 … OFDM sym...

MUSIC Algorithm Explained (with MATLAB + Simulator)

Practical Implementation of the MUSIC Algorithm The focus is on how the algorithm works computationally , not just theory, and it explains the denominator (a H E n E n H a) mathematically and intuitively. 1. Introduction The MUSIC (Multiple Signal Classification) algorithm is a high-resolution method used in signal processing and array processing to estimate the Direction of Arrival (DOA) of signals received by a sensor array. Unlike classical beamforming methods, MUSIC uses eigenvector decomposition of the covariance matrix to separate the signal subspace and noise subspace , allowing it to achieve much higher angular resolution. In practical implementations, MUSIC works by: Simulating or collecting array signals Computing the covariance matrix Performing eigenvalue decomposition Separating signal and noise subspaces Scanning possible angles using a steering vector Constructing a pseudo-spectrum where peaks indicate signal directions 2. Signal Mo...